Visualizing Data with Composite Tests
In this tutorial we’ll set up a test list that uses an uploaded text file to fit a line to some data, and plot the data as well as the best fit line.
The csv file we’ll be using looks like this:
0.0000,0.1821
1.0000,1.5899
2.0000,3.1447
3.0000,4.3780
4.0000,6.0144
5.0000,7.4758
6.0000,9.0759
7.0000,10.6360
8.0000,11.8331
9.0000,13.2787
10.0000,14.8097
and our goal is to upload this file, fit a line, and record the slope and intercept of the line. Save the data file for later.
To accomplish this, we need to set up a test list with three tests:
An Upload test that will parse the data from the file, fit the line, and generate the plot using matplotlib.
A Composite test to record the slope of the line.
A Composite test to record the intercept of the line.
Configuring the Tests
Navigate to the admin section of the site and click on the Tests item in the QC section.
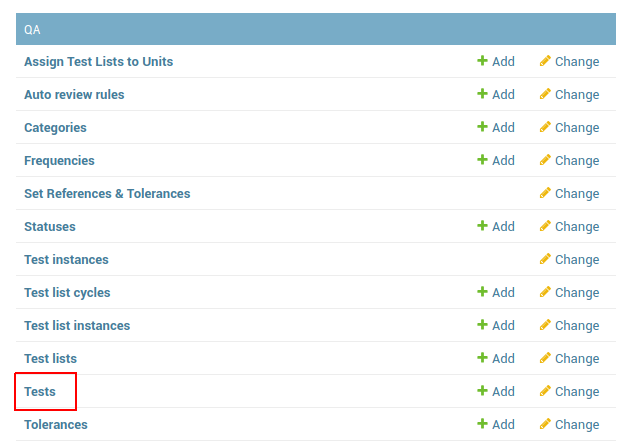
Tests admin link
Now click on the Add Test button at the top right of the next page:
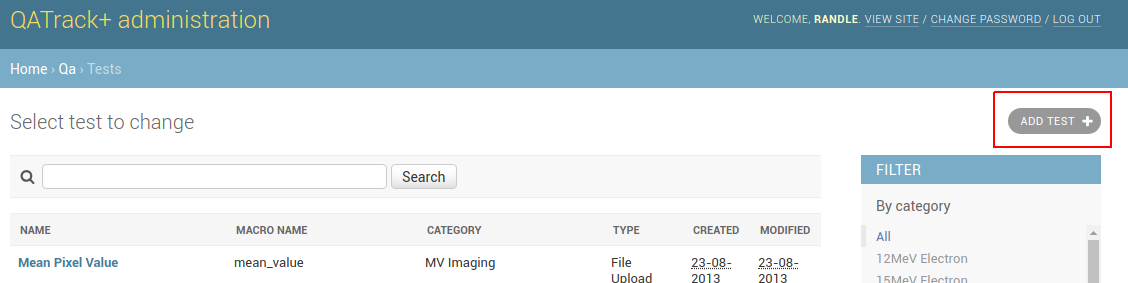
Add test button
Then fill out the Test fields as follows:
Name: Data upload
Macro name: data_upload
Category: (pick any available category, or add a new one)
Type: File Upload
Display image: Make sure this is checked so that our plot will be visible
Calculation procedure:
import matplotlib
import matplotlib.figure
import matplotlib.style
import numpy as np

matplotlib.style.use("seaborn")

# read the data and put the x, y values in xs, ys
xs = []
ys = []
for line in FILE:
    x, y = map(float, line.strip().split(","))
    xs.append(x)
    ys.append(y)


# polyfit of degree 1 can be used to fit line
slope, intercept = np.polyfit(xs, ys, 1)

# calculate some datapoints of the line of best fit for display
fit_ys = [slope*x + intercept for x in xs]

# plot the data
fig = UTILS.get_figure()
axes = fig.gca() # gca == get_current_axes
axes.plot(xs, ys, 'o', label="Raw data")
axes.plot(xs, fit_ys, label="Best fit line")

# use QATrack+ UTILS to save the plot as an image
UTILS.write_file("fit_line.png", axes)

# set the final result which can be used by other composite tests
data_upload = {'slope': slope, 'intercept': intercept}
This should look similar to:
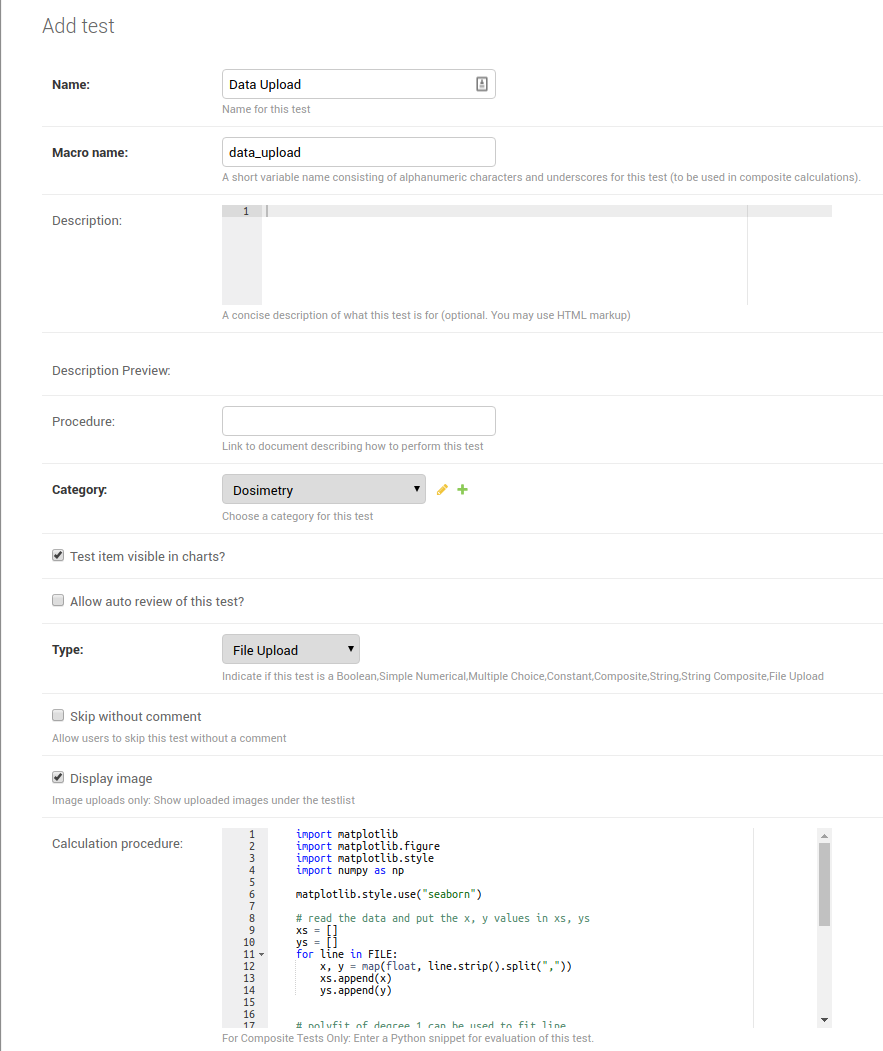
Upload data test config
Once you have that complete click Save and add another and create another Test:
Name: Slope
Macro name: slope
Category: (pick any available category, or add a new one)
Type: Composite
Calculation procedure:
slope = data_upload['slope']
And again click Save and add another and create the final Test:
Name: Intercept
Macro name: intercept
Category: (pick any available category, or add a new one)
Type: Composite
Calculation procedure:
intercept = data_upload['intercept']
Then click Save
Settting up the Test List
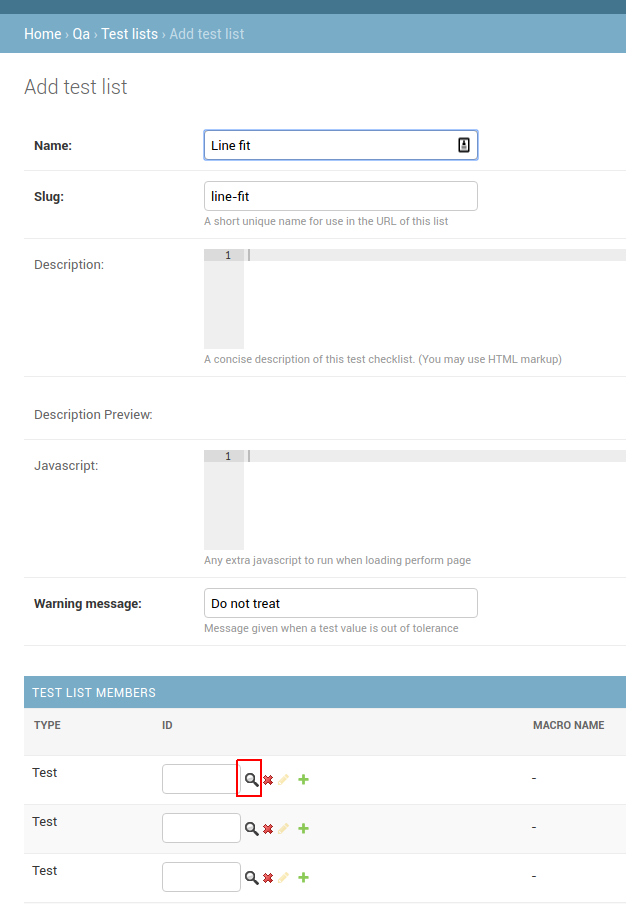
Navigate back to the Home or QC page of the Admin area and then create a new Test List by clicking the Test List link in the QC section and then clicking the Add Test List button.
Give your test list the name Line fit example or similar, then in the Test List Members section, click on the magnifying class next to the first Test box:
Find a Test for your Test List
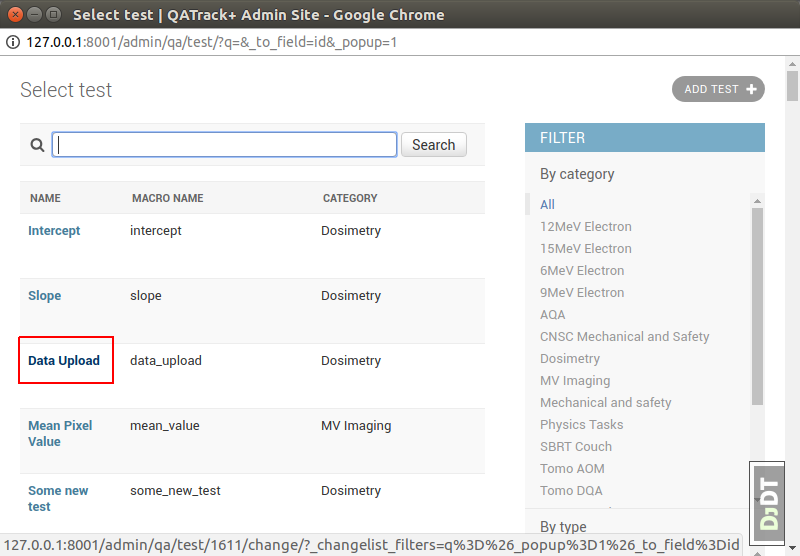
and then select the Upload Data test:
Select a Test for your Test List
Do the same for the Slope and Intercept tests:
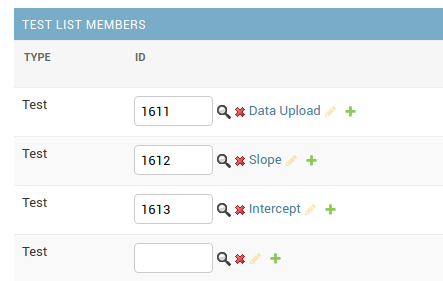
All tests selected
Then click Save.
Assigning the Test List to a Unit
Navigate back to the Home or QC page of the Admin area and then assign the Test List by clicking the Assign Test Lists to Units link in the QC section and then click the Add Unit Test Collection button at the top right.
Fill out the required fields:
Select a Unit from the Unit drop down
Select a Group from the Assigned To drop down
Choose one or more Groups (your user must be part of one of the groups) in the Visible to control
Select test list in the Test List or Test List Cycle drop down
Finally select the Line fit (or whatever you called it!) Test List in the Tests collection field.
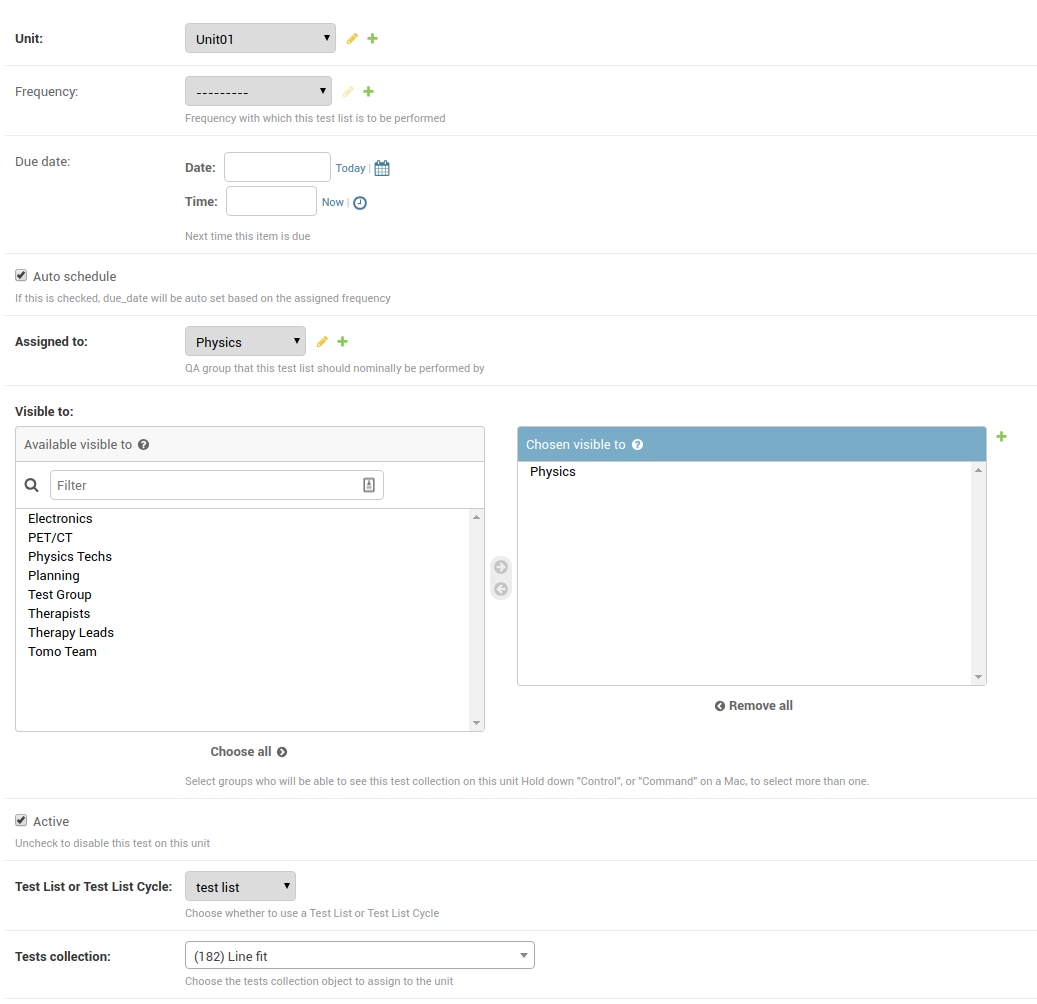
Assign Test List to Unit
Now click Save and Continue Editing which will bring you back to the same page. You can then click View on site to perform the Test List
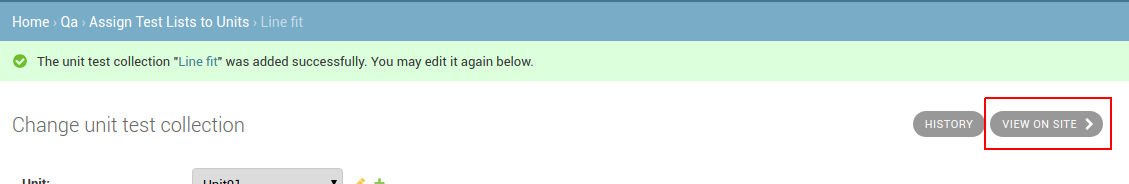
View on Site
Performing the Test List
Click the Upload button in the Data Upload column and select the file you saved earlier.
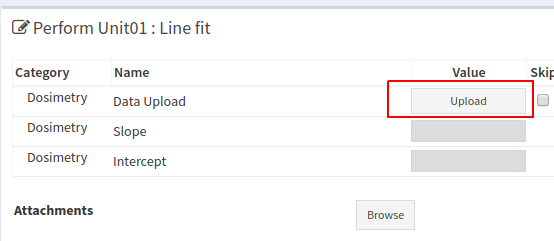
Upload button
If everything was set up correctly you should see the following:
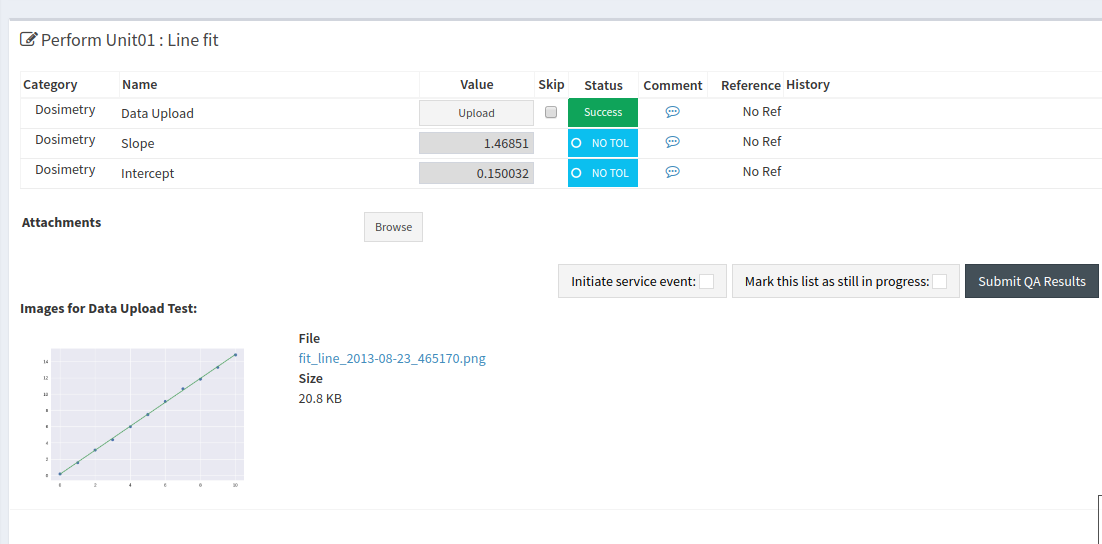
Performed Test List
You can now submit your results!